Turning IOP and BCVA Data Into Actionable Clinical Insight
In today’s busy optometry clinics, patient data is abundant but actionable insight is not always easy to access. Clinicians regularly collect intraocular pressure (IOP) measurements, best corrected visual acuity (BCVA), imaging results, and other exam findings, yet interpreting trends over time can be time-consuming and fragmented across systems.
Care1 was designed to change that by transforming raw exam data into clear, intuitive visual insights that support better clinical decision-making.
Visualizing What Matters Most
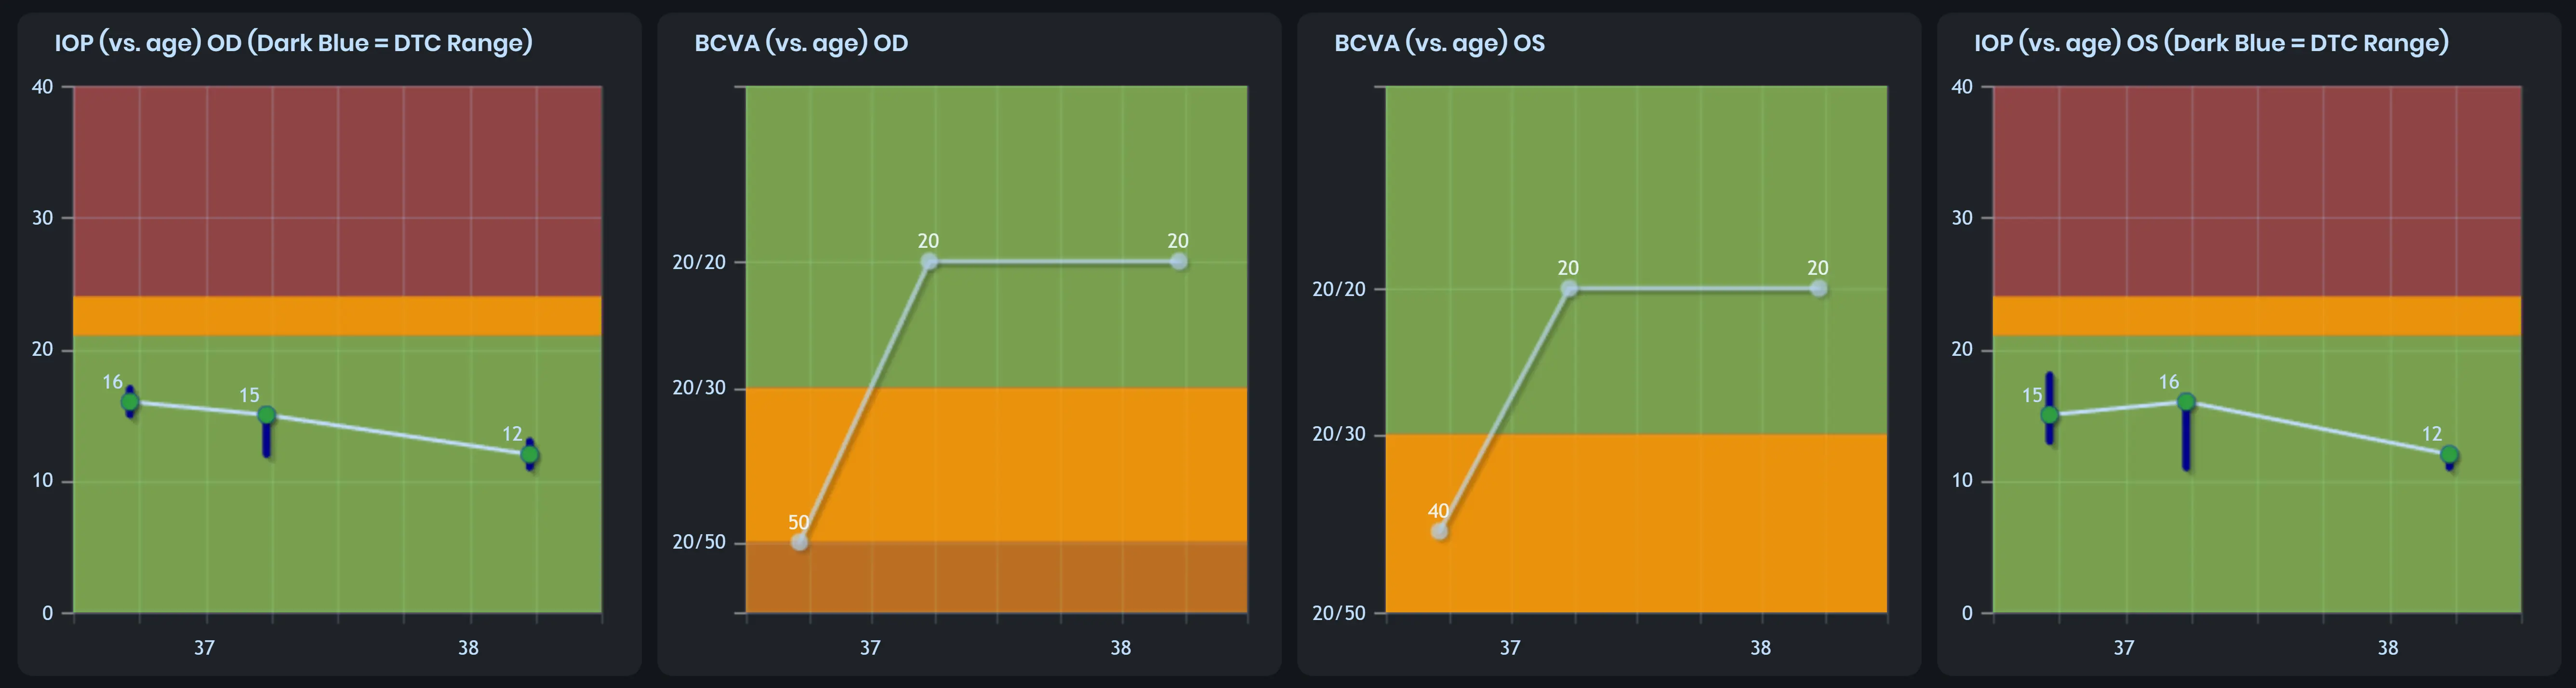
On the Care1 platform, optometrists can easily visualize IOP and BCVA trends plotted against patient age for both the right eye (OD) and left eye (OS). These charts bring together historical exam data in one place, allowing you to quickly see how a patient’s ocular health is changing over time.
Rather than scanning through multiple past visits or reports, clinicians can instantly recognize:
- Whether IOP is stable, rising, or fluctuating
- How visual acuity has changed relative to age-related expectations
- Subtle differences between OD and OS that may warrant closer monitoring
Side-by-Side Comparisons for Better Decisions
Care1’s side-by-side visualization of OD and OS supports more accurate and confident assessments. Comparing both eyes at a glance helps clinicians identify asymmetry, progression patterns, or early warning signs that could otherwise be missed during routine review.
This is particularly valuable in chronic conditions such as glaucoma, where small changes over time can have significant clinical implications.